Measurement of signal-to-noise ratio (SNR)
Introduction
The signal-to-noise ratio (SNR) is the ratio of the power of a desired signal to the power of background noise. SNR is measured in decibels (dB).
The electric characteristics of the sensor determine which SNR that can be achieved. The more even the electric characteristics of a sensor are, the better SNR the sensor will have. Modern, light-sensitive sensors are shot-noise limited to a higher degree than older sensors, which means that photon shot-noise is the dominating noise factor.
This white paper details the method by which Axis measures the SNR required by Axis video products to produce images of a specified quality. The SNR measurement described here is used for comparisons between different combinations of optics, that is, camera blocks in combination with sensors. SNR measurement is one step in our process to ensure state-of-the-art image quality.
An effective SNR
This chapter describes briefly how an abridged, best-case SNR can be estimated based on measurements on a gray card. The images in this measurement all concern the processed image after the image processing pipeline (IPP), that is, the image presented to the end user. No human-reception weighting of the data is performed. Measurements are performed with sensor gain disabled, and the noise is assumed to be uncorrelated. Axis cameras used for SNR measurements are always operating in day mode with their IR-cut filters enabled.
SNR measurement method used at Axis - a summary
Use a gray card with a reflectance value of approximately 30%.
Axis gray card exposed at default settings. Set up a minimum of two (2) broadcasting light boards to provide even illumination of the scene. The illumination level should be 2.0 klx at the scene and the color temperature should be 6500 K. The iIllumination level and color temperature have been chosen since this is a condition often found in broadcasting.
Turn off the gain of the sensor.
Position the lens at wide.
Adjust the camera so that the gray card covers the entire image.
Tune the shutter time manually to achieve an image that is just below saturation, that is, the highest read ADC value should be ≤ 254.
Exposure just below saturation. Take five (5) snapshots of the scene. Exposure time should be less than one (1) frame.
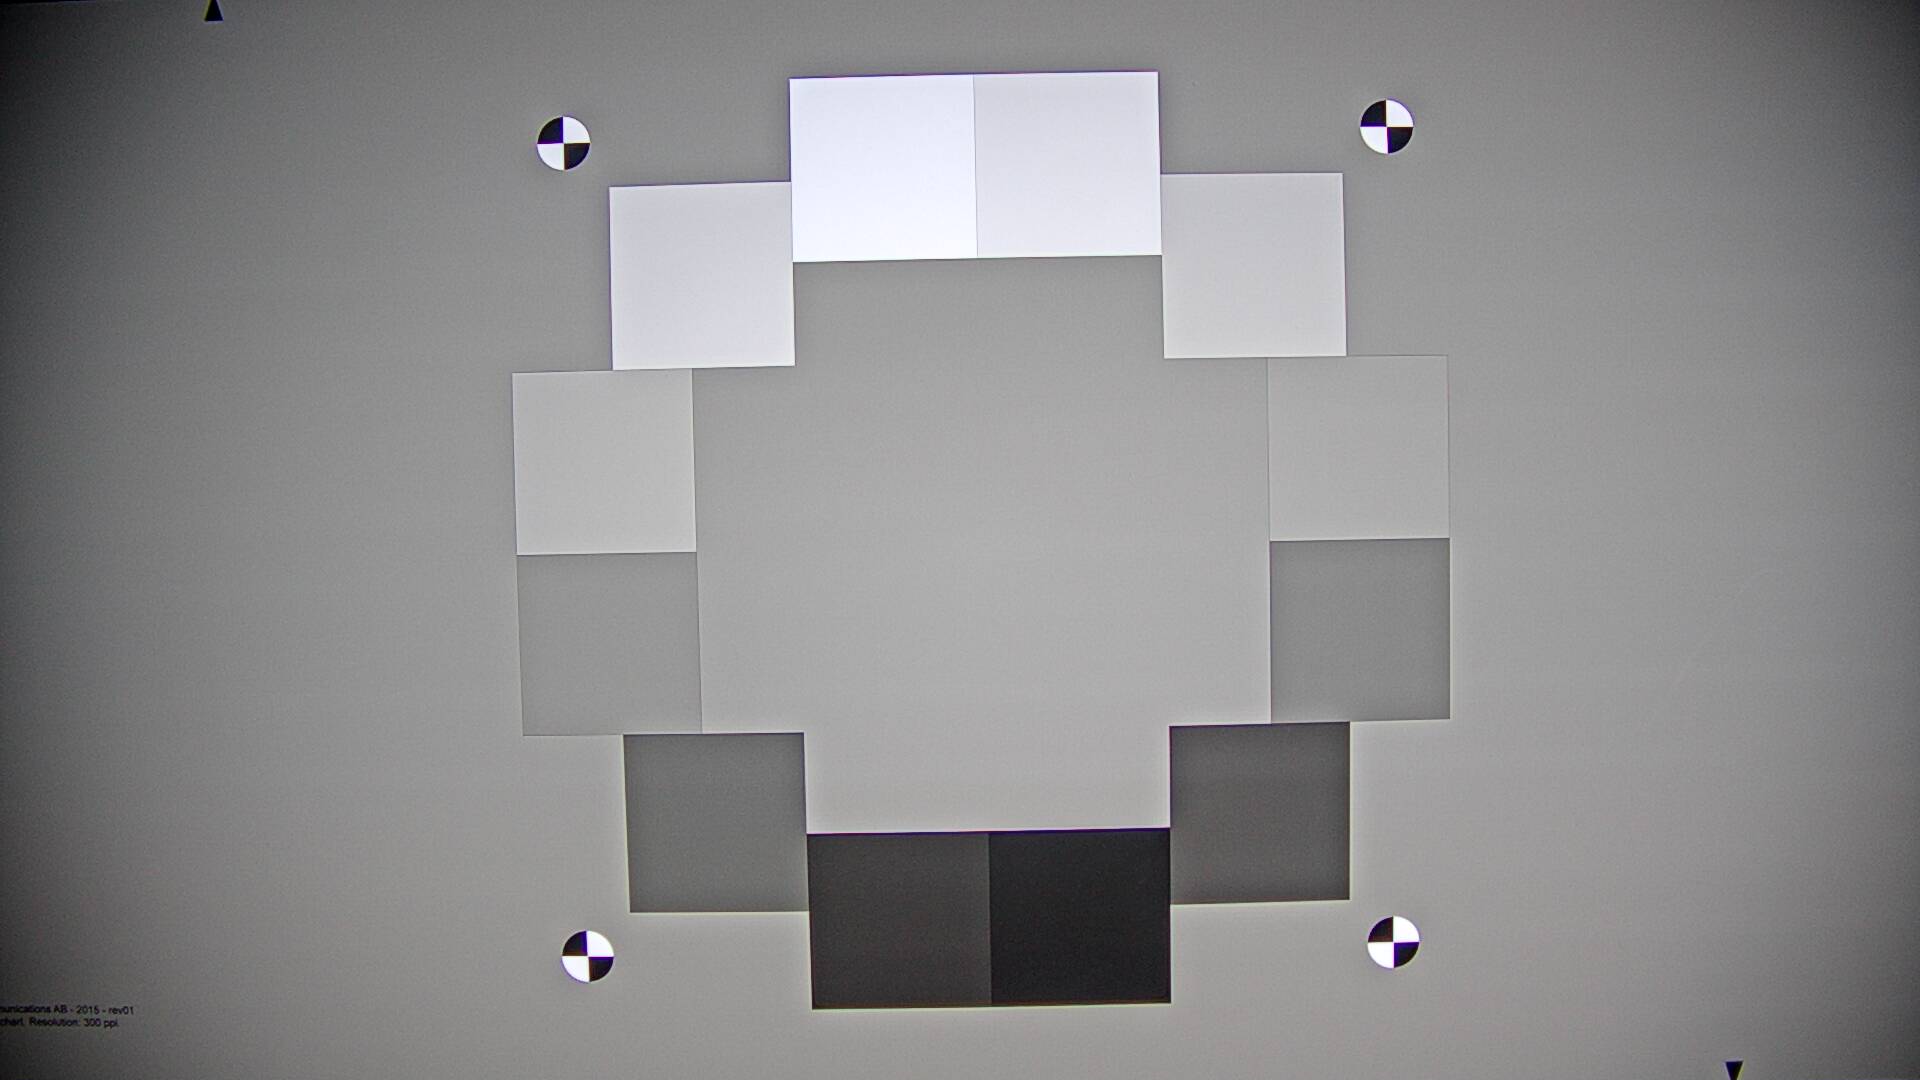
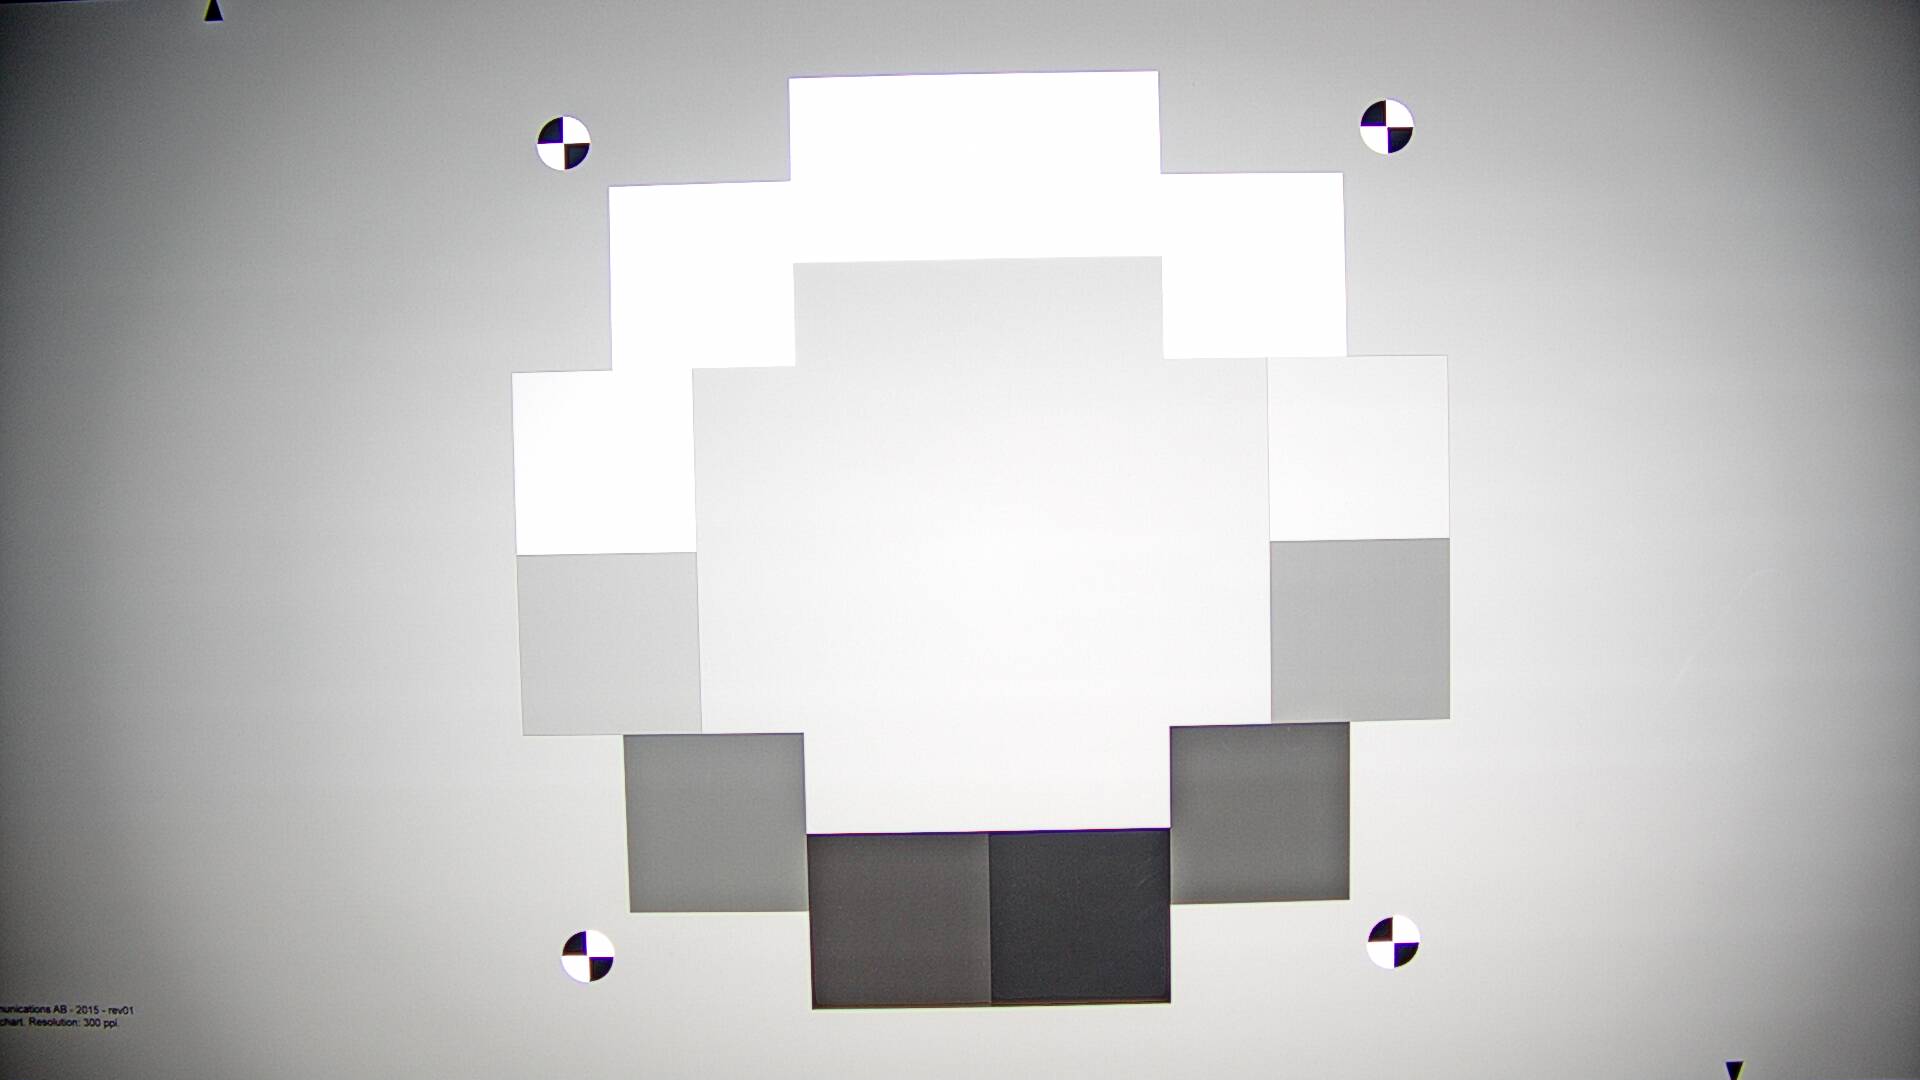
Within each snapshot, plot the intensity profile and find the peak of the profile. In order to achieve a practical SNR, determine the size of a region around the peak that provides a relatively flat intensity profile (cropped region). For a 1080p sensor, a suitable region size is 100×100 pixels.
The reason for cropping the image to a region is to avoid the effects of vignetting from the optics and possible uneven illumination which would provide misleading values.
Within each cropped region, compute the SNR according to equation 1, where μR;G;B and σR;G;B are the means and standard deviations of each color channel.
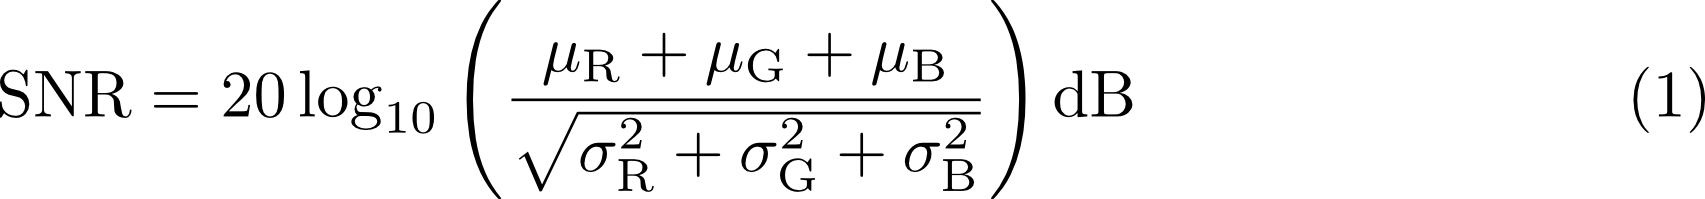
Approximate the final SNR as an average of the SNRs from the five snapshots.